
Understand today. Plan for tomorrow.
Customizable dashboards, real-time activity feeds, and role-based access to the numbers that matter - so club leadership has the visibility to make decisions, with everyone working from the same picture.
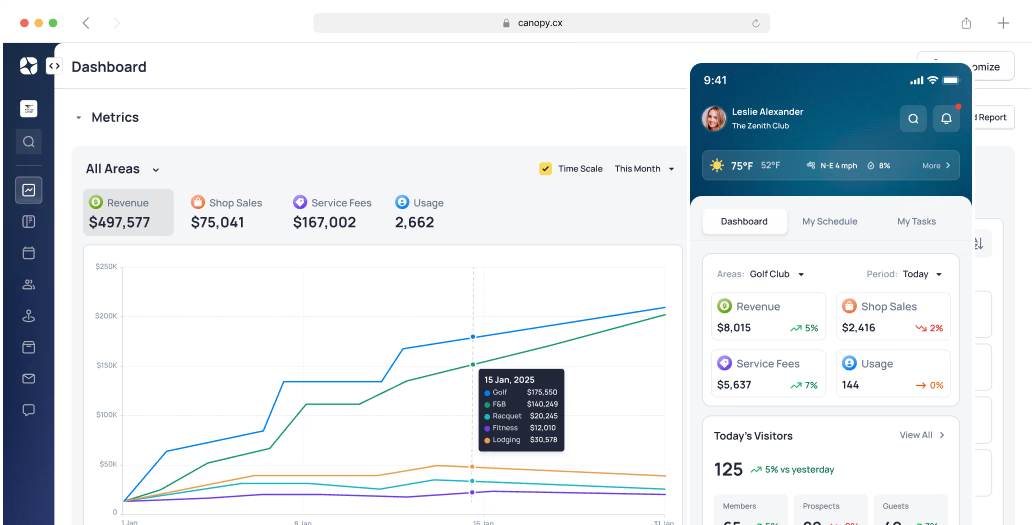

Decisions made with complete information
Running a great club requires visibility - into how facilities are being used, who's coming through the door, how revenue is tracking, and what members are actually using. Without that visibility, decisions get made on instinct rather than insight, opportunities get missed, and issues go unnoticed until they're already problems.
Canopy brings everything together in one unified platform - which means the data is already unified too. No pulling reports from five different systems. No waiting for someone to compile a summary. The intelligence you need is available, in real time, configured for each role across the club.
The Result: A club where every team member - from the GM to the department head to the front desk - has the information they need to act with confidence.
Dashboards and data for every role
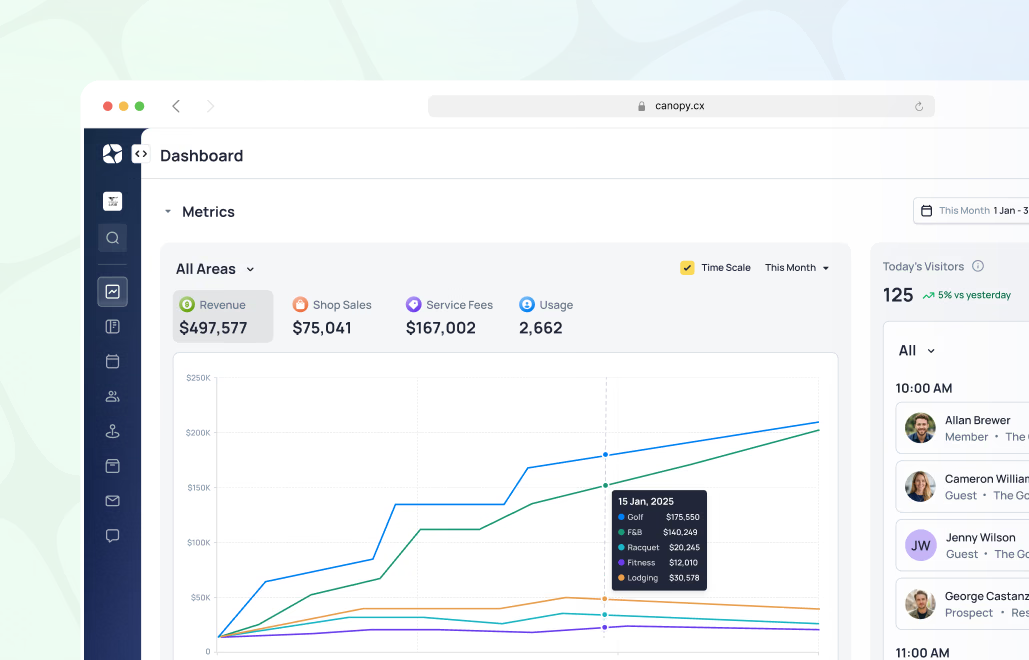
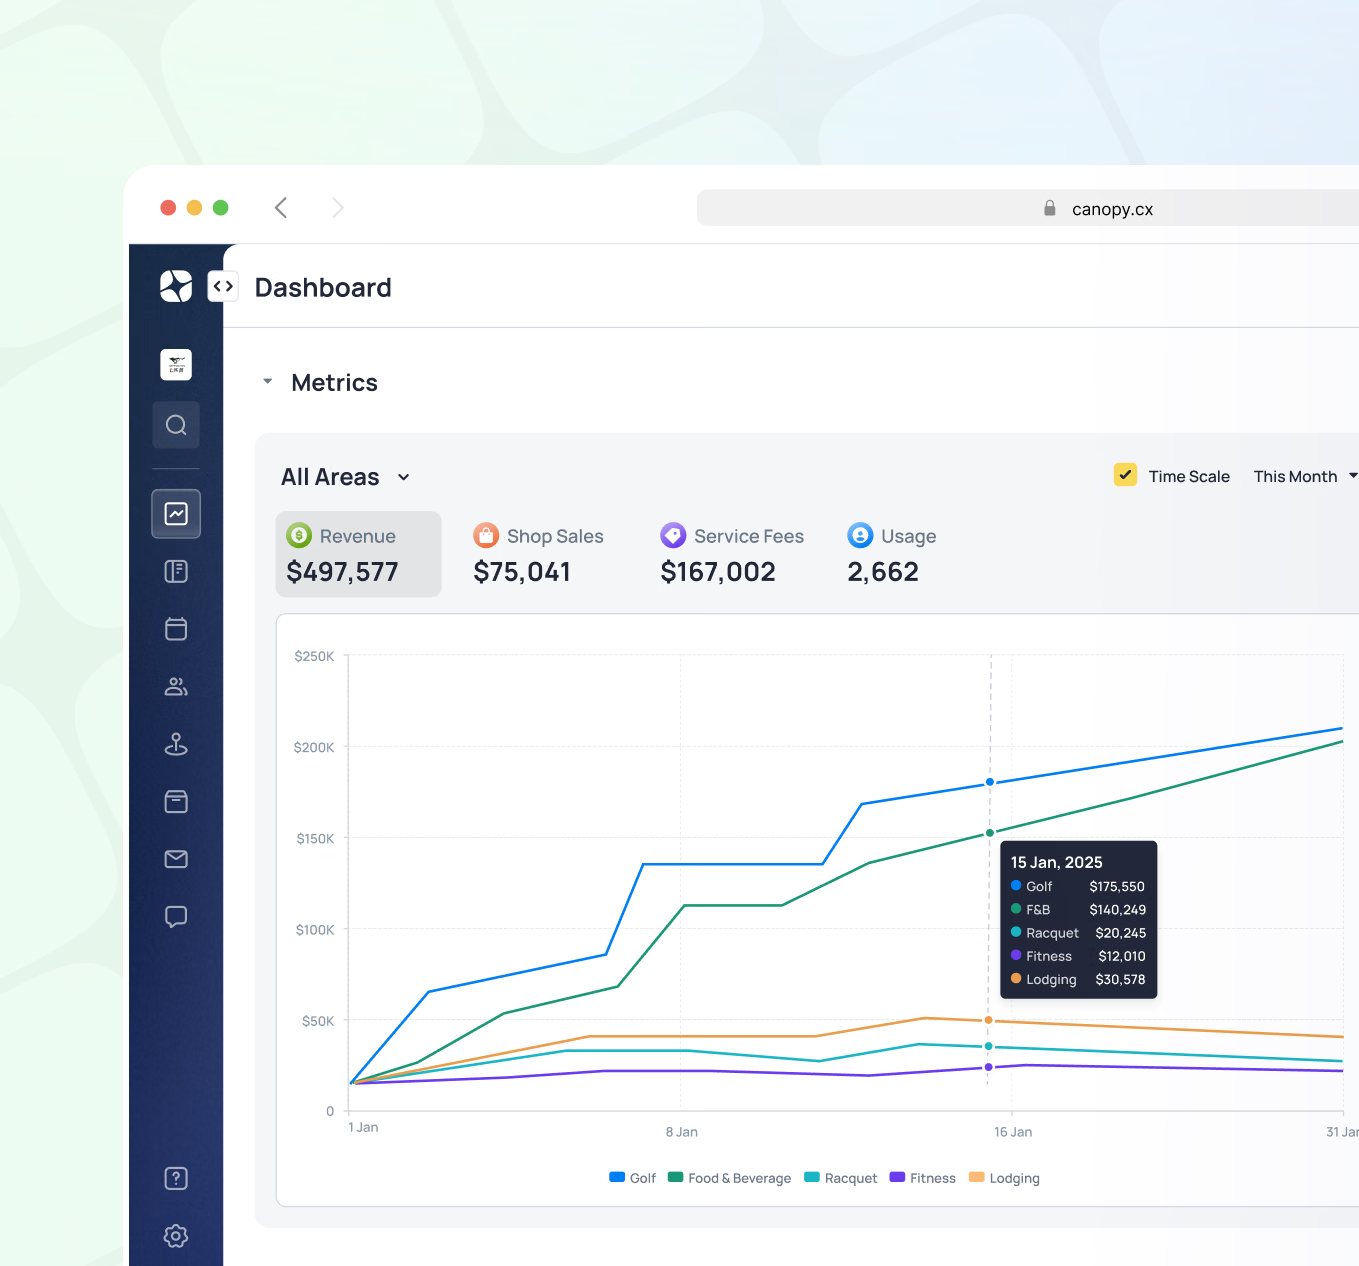
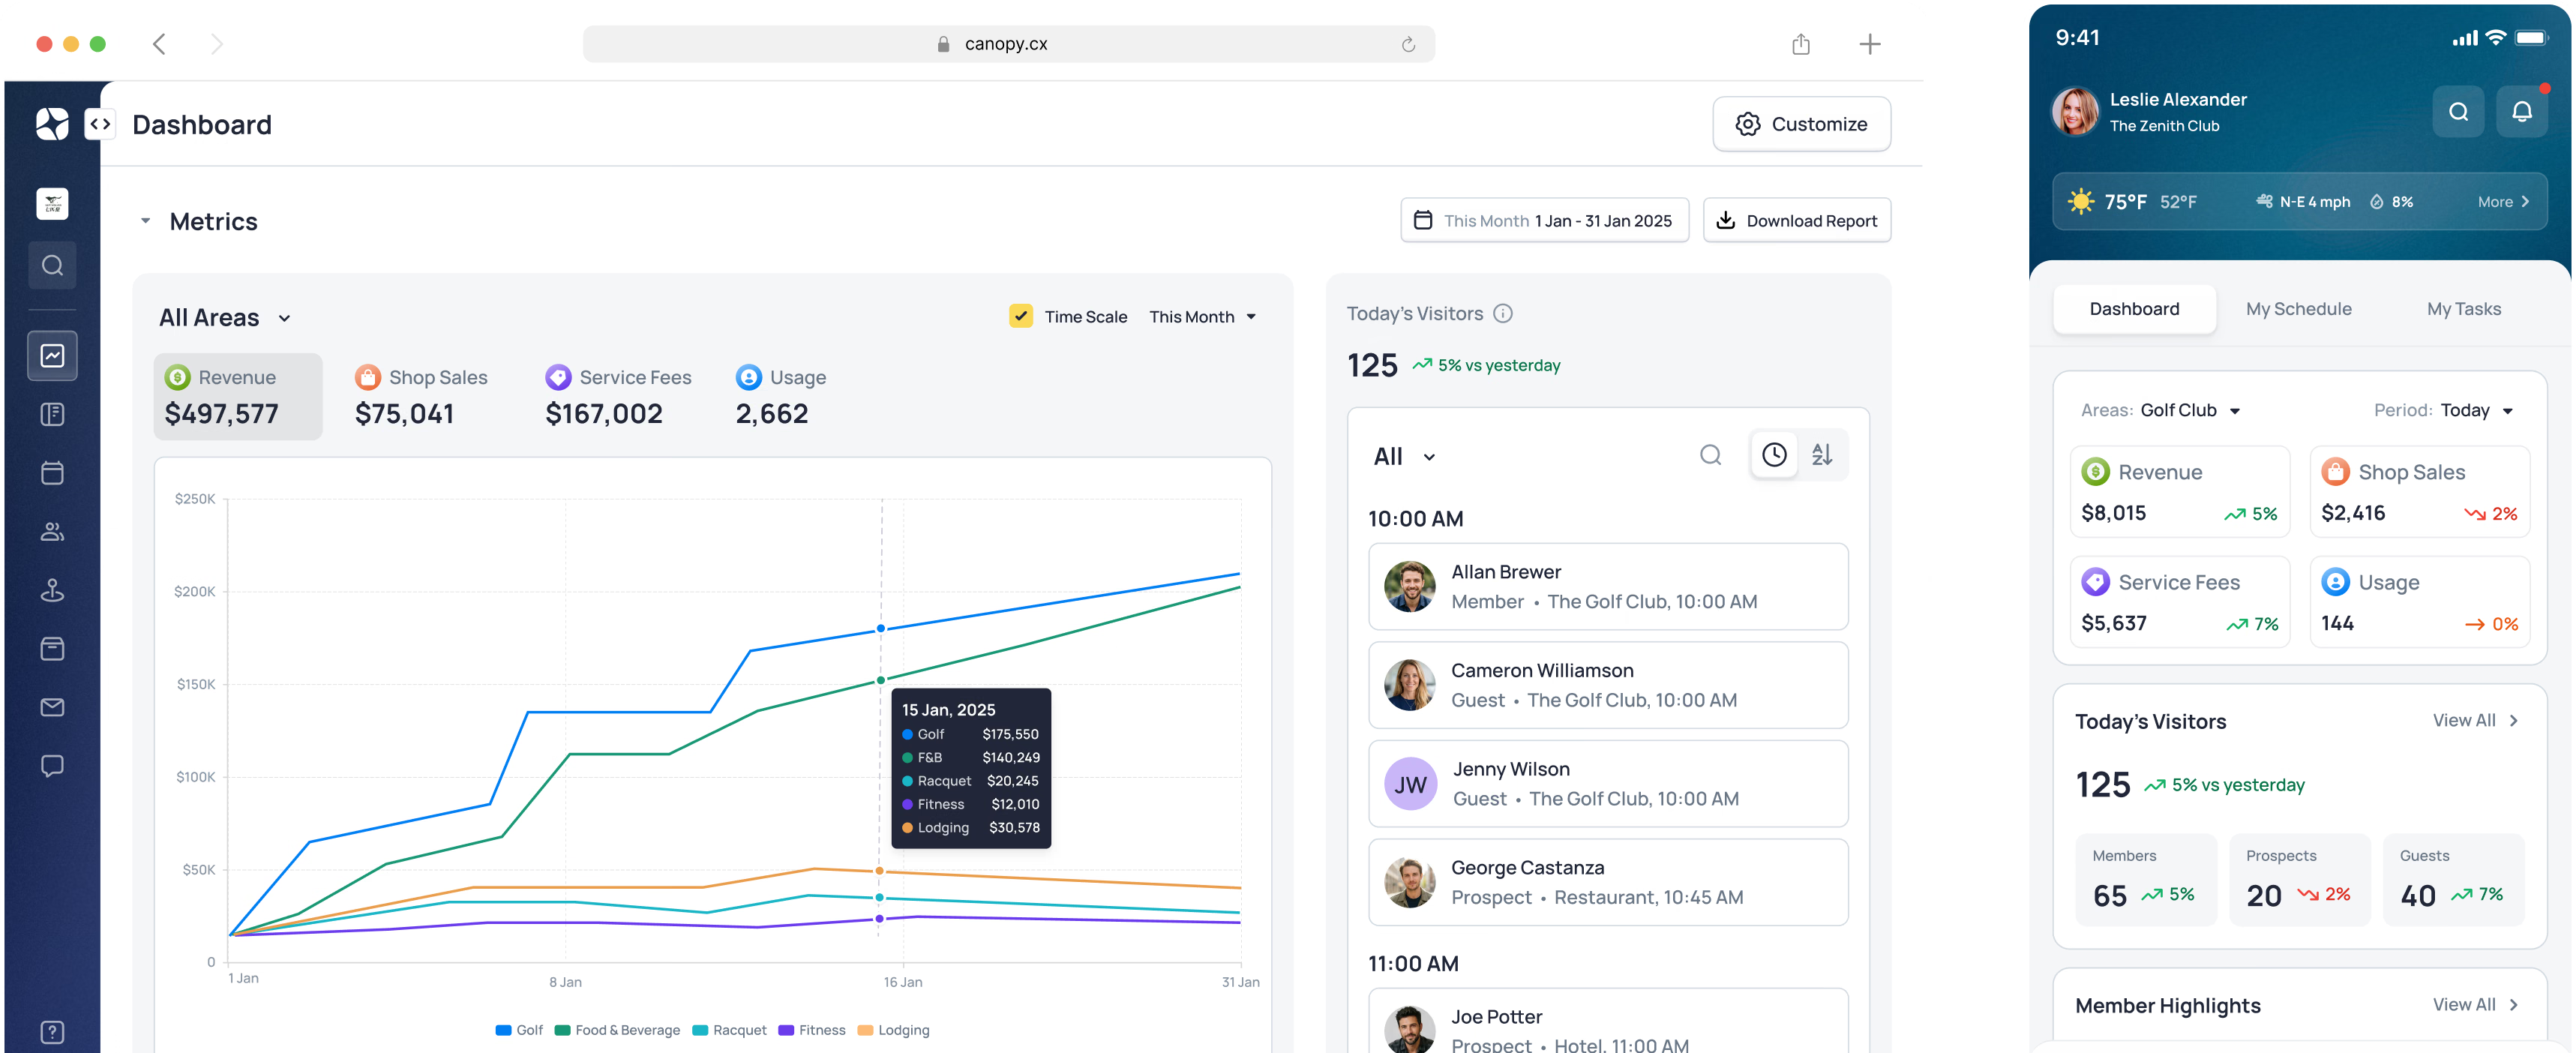
Every user in the system has a dashboard configured for their role. Pre-built views for GMs, F&B directors, golf professionals, membership directors, and department staff give each person a focused, relevant starting point - with the ability to customize further based on their priorities. Dashboards are available on desktop and mobile.
- Pre-built dashboard configurations by role
- Customizable widgets and layout for each user
- KPI selection by department and function
- Drilldown from summary view to transaction-level detail
- Mobile dashboard access for management and staff on the go
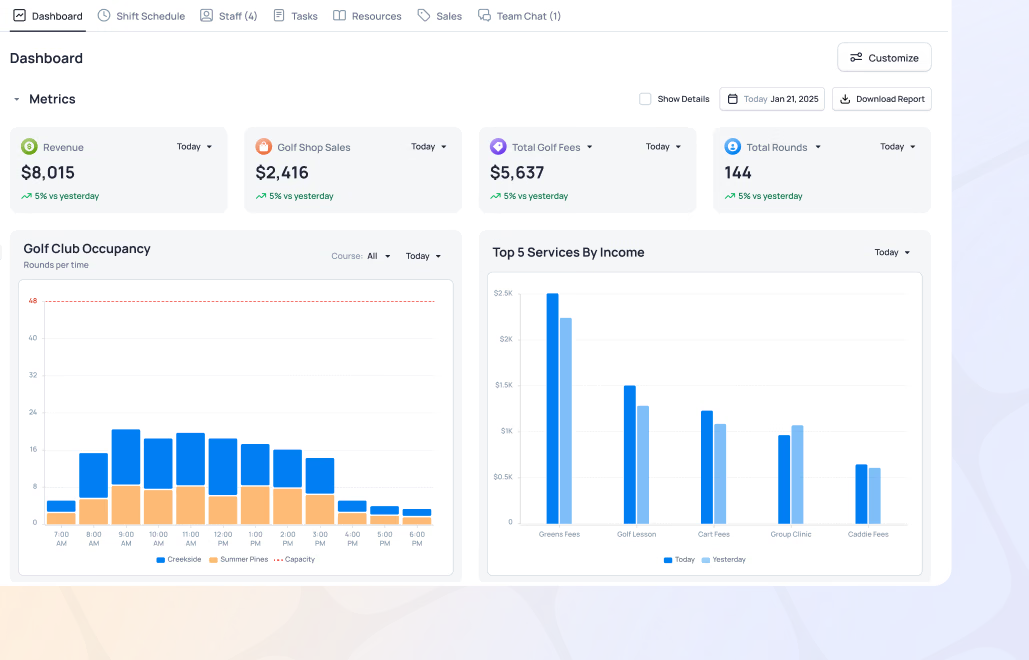
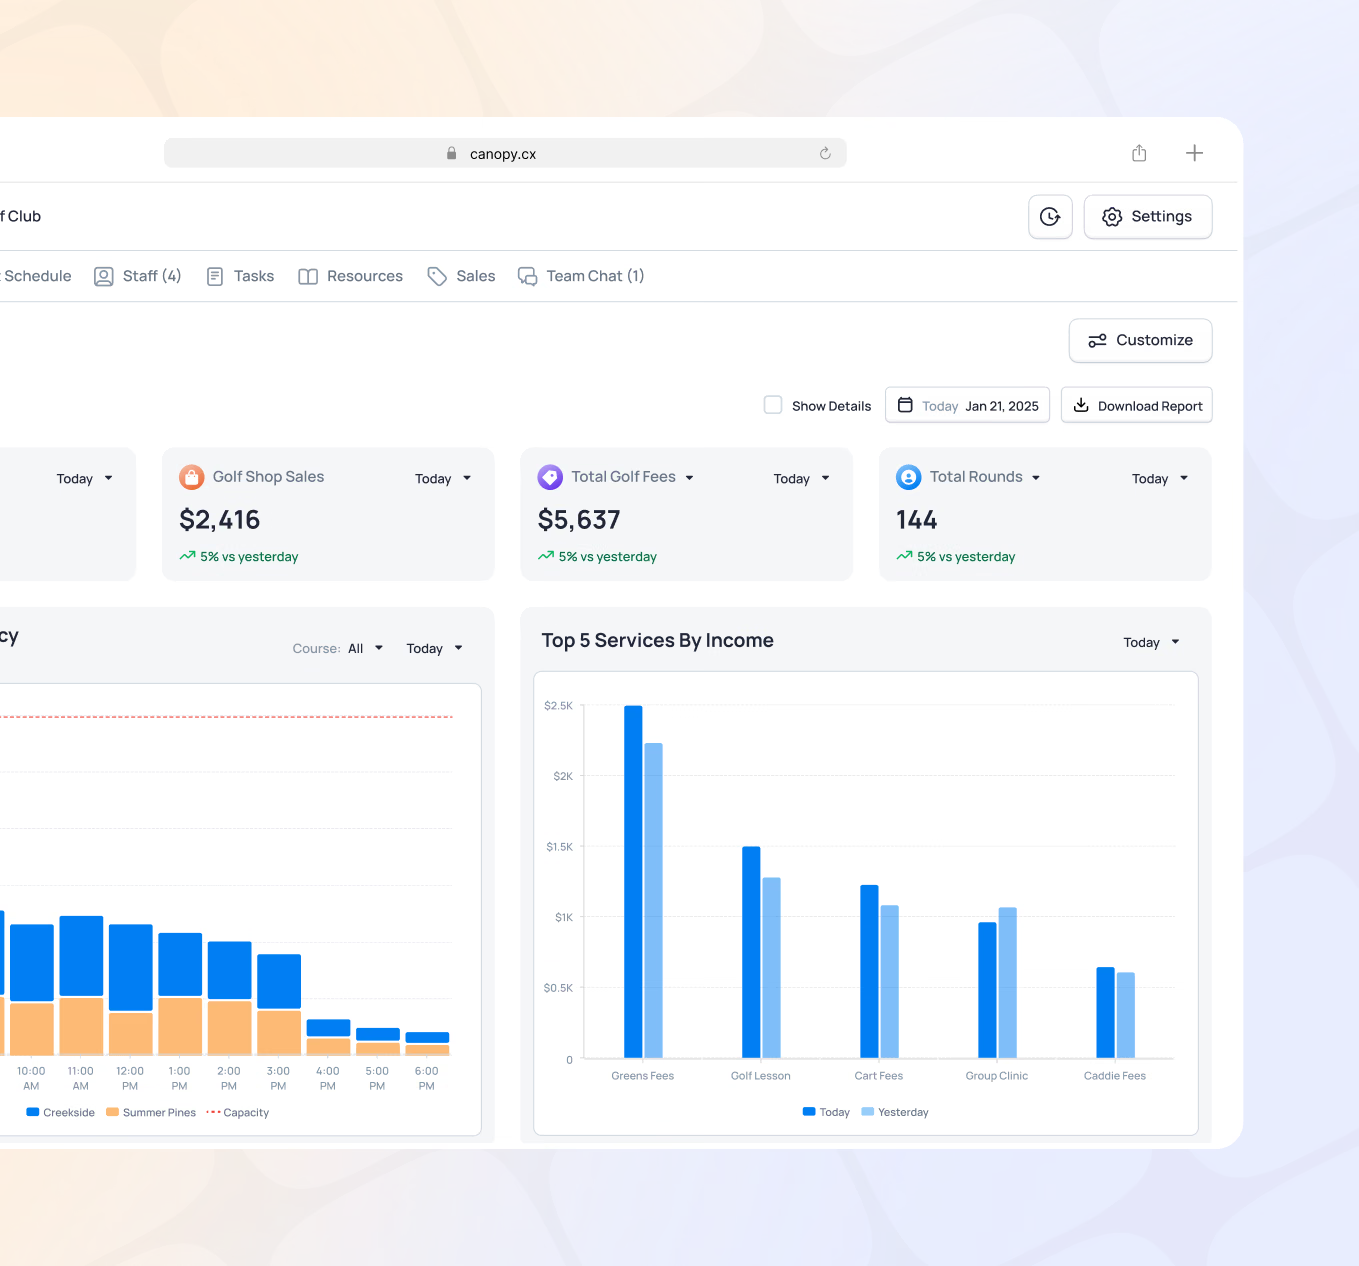
Understand how your club is being used - by amenity, by day, by member segment. Daily usage counts segmented by members and non-members give a clear picture of who is driving activity. Capacity versus actual occupancy shows where demand is strong and where there's room to grow.
- Amenity utilization rates by time period
- Daily usage counts segmented by members and guests
- Capacity vs. actual occupancy by amenity and location
- Usage patterns across days and periods
- Activity data informing programming and staffing decisions
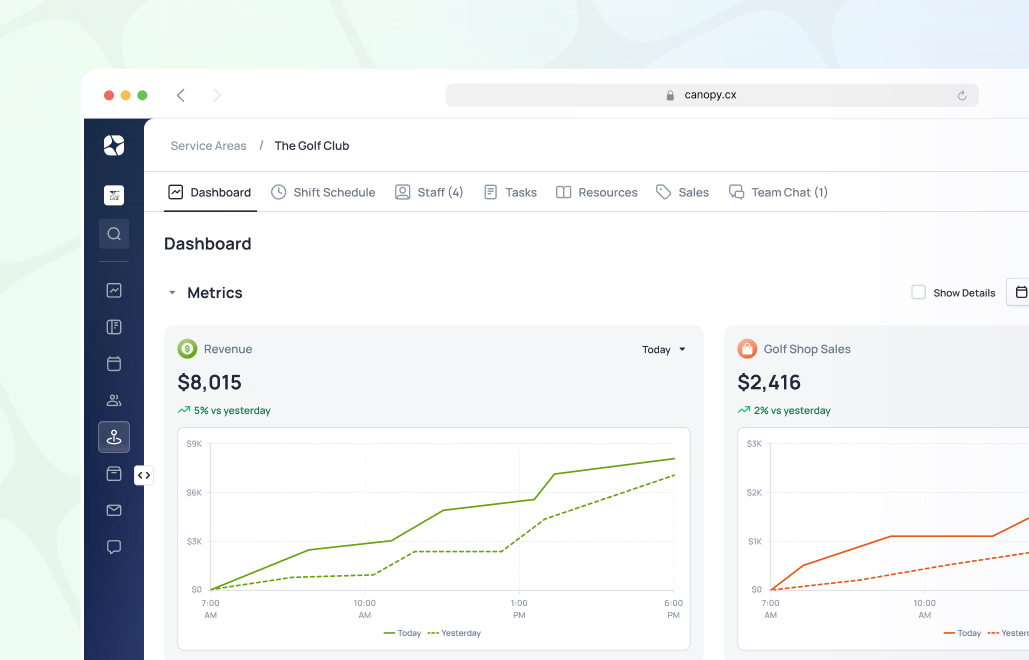
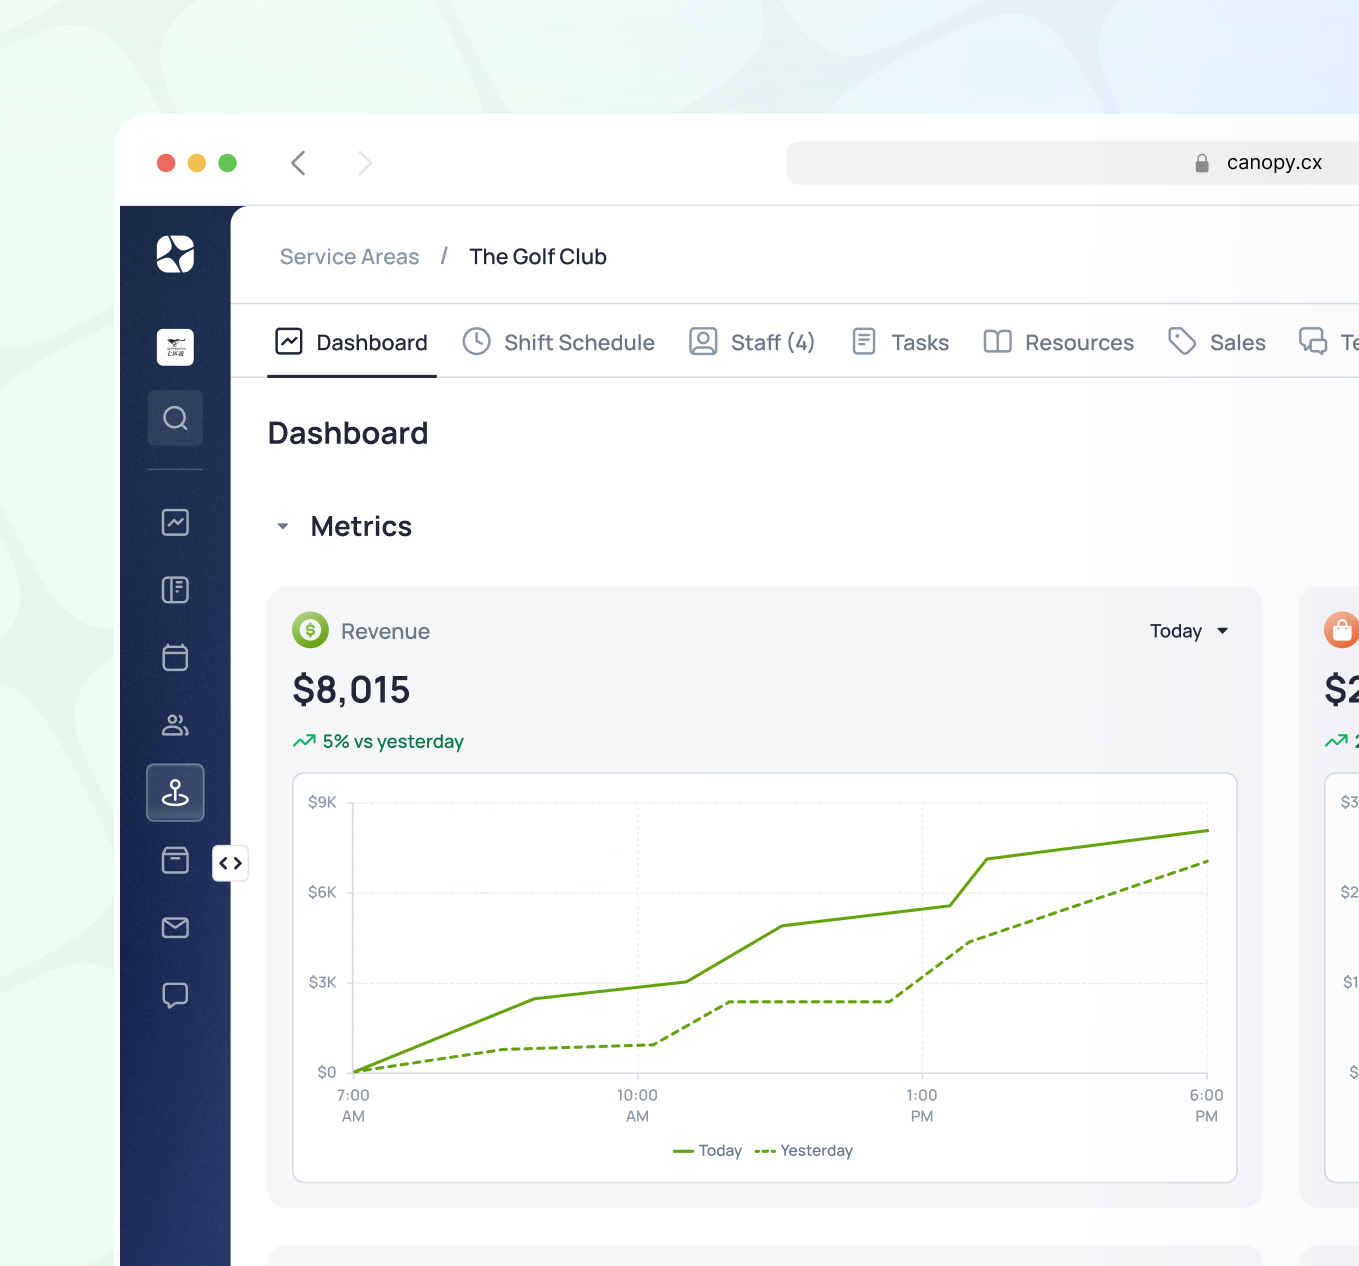
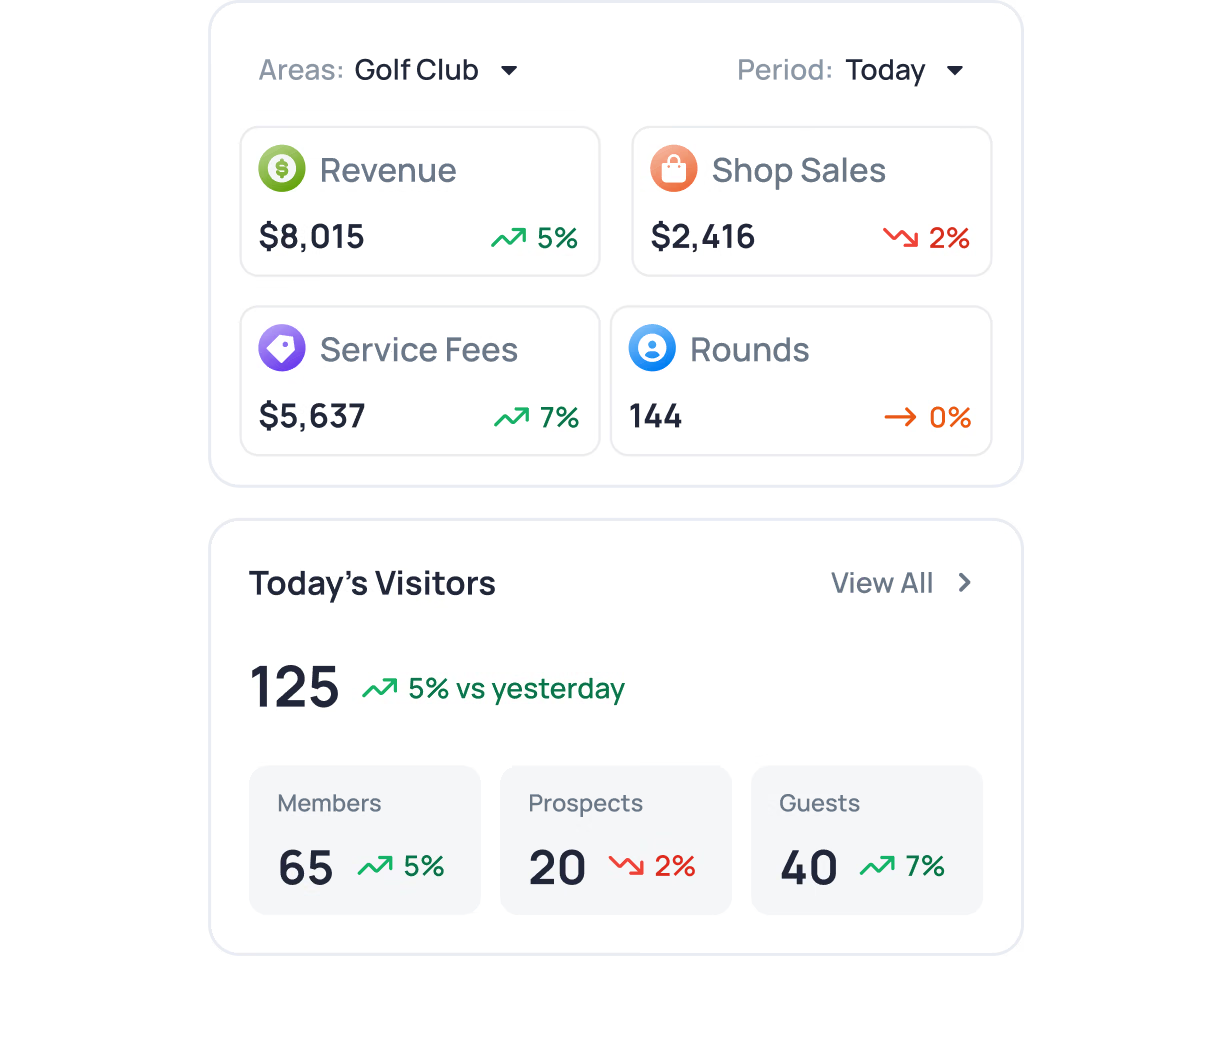
Revenue tracked by area, amenity, services, merchandise, and trends over time - giving management a clear view of where revenue is coming from and how it's moving. Daily, monthly, and annual summaries available for every department. Clean data exportable for accounting and reporting.
- Revenue by area - golf, F&B, spa, events, dues, and merchandise
- Revenue by amenity and service type
- Daily, monthly, and annual revenue summaries
- Trend tracking over time by category
- Export for accounting and external reporting
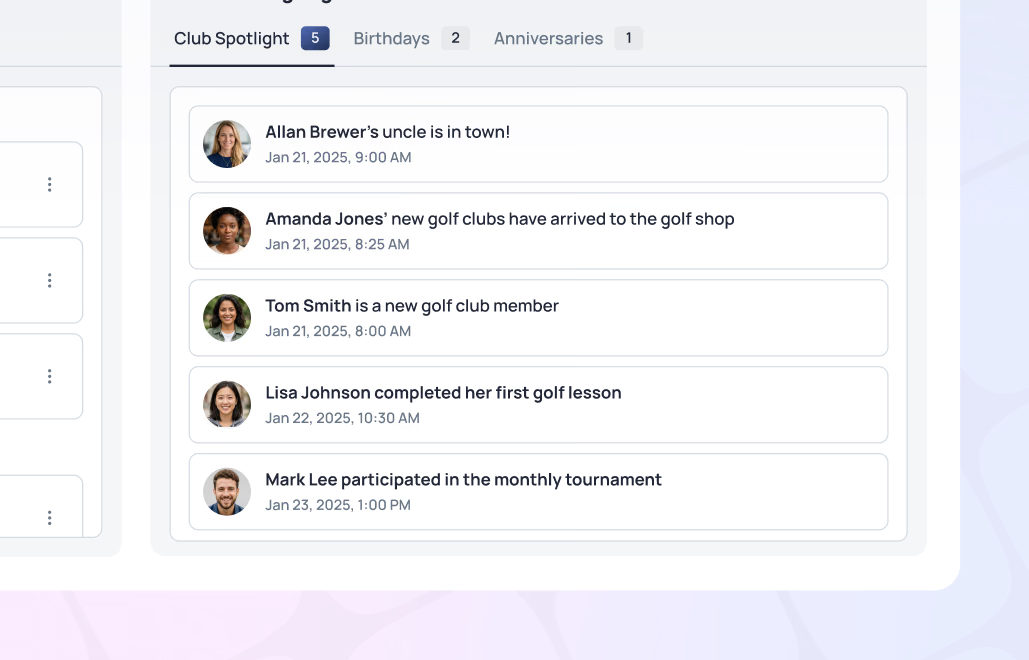
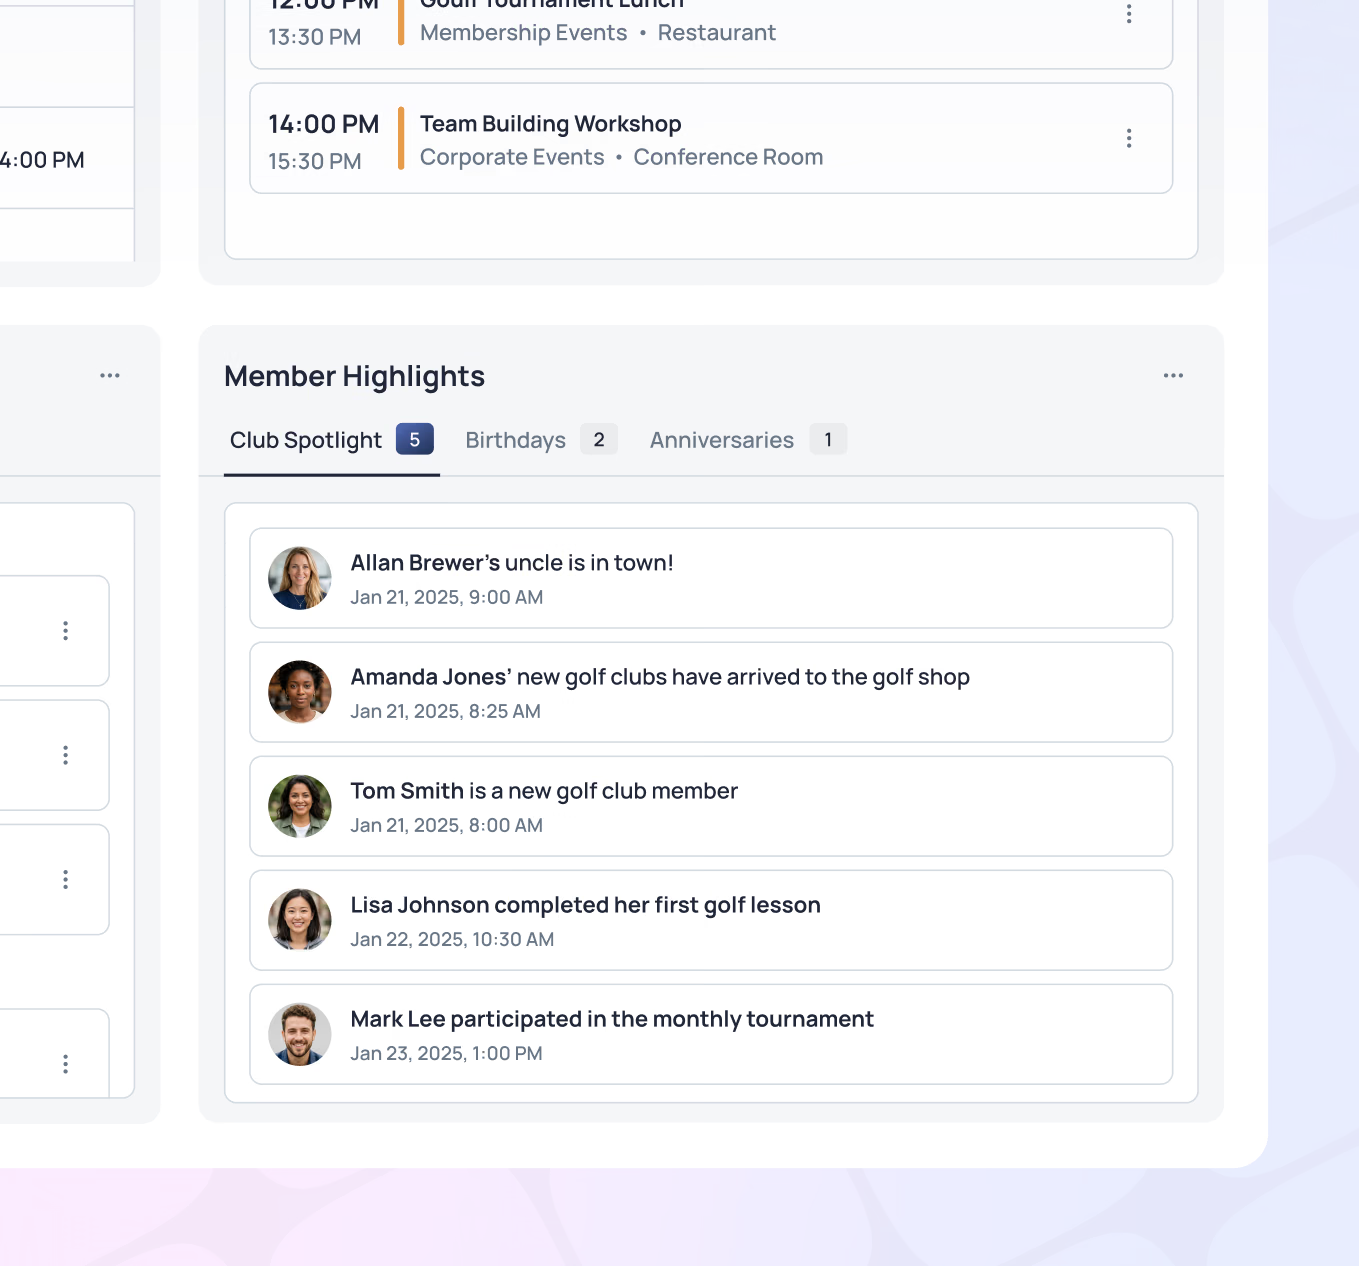
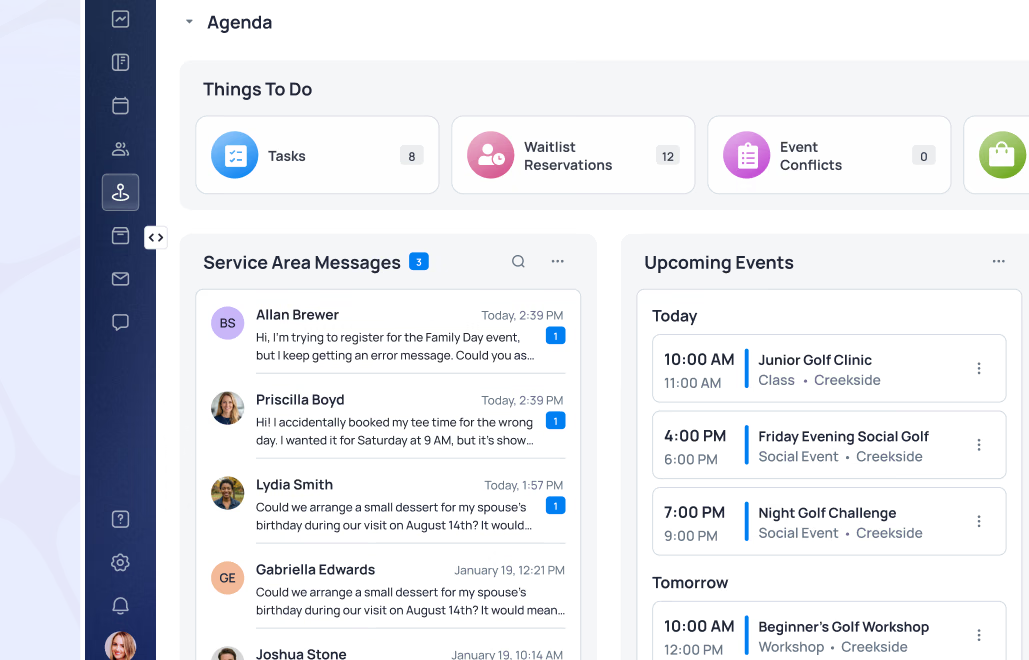
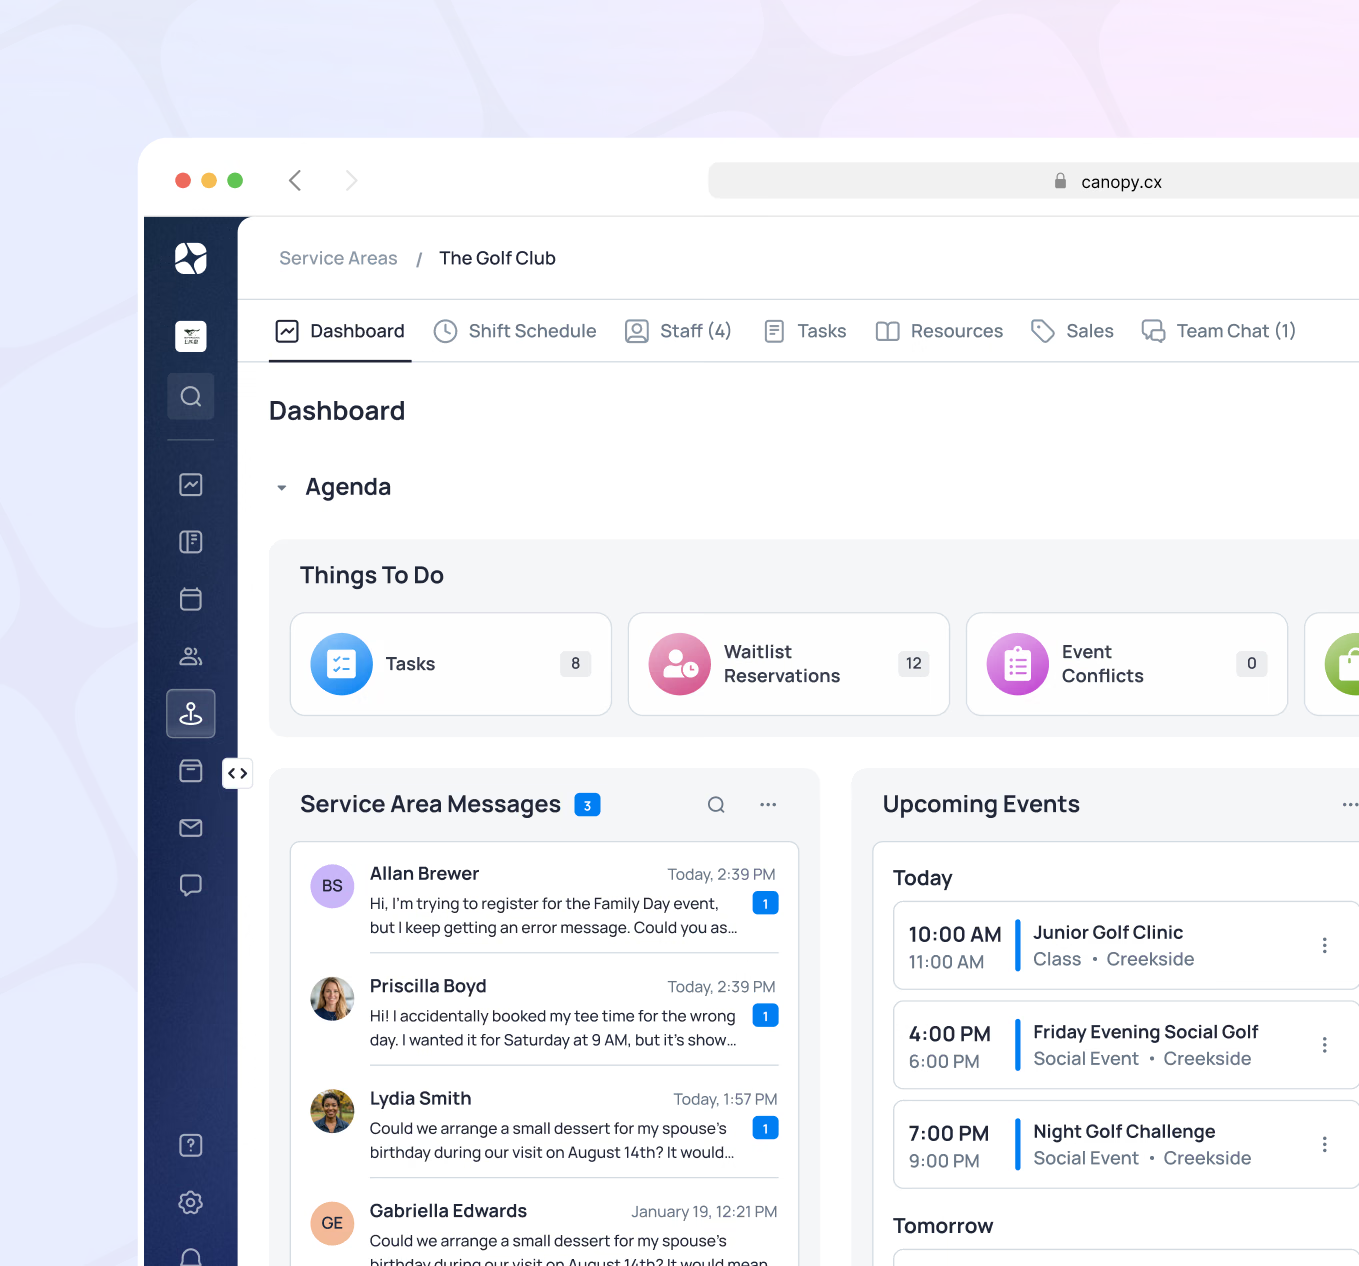
Keep the team informed and connected to what's happening with members - today and this week. Member highlights surface who's celebrating a birthday, who's visiting for the first time in a while, and who's most active. Messages, upcoming events, and recent activity all visible to staff and management based on their role and access level.
- Member highlights - birthdays, notable visits, membership milestones
- Recent member activity and visit history
- Messages and team chat highlights surfaced on dashboard
- Upcoming events and registrations by department
- Staff and management access configured by role and permissions
When a question goes deeper than the dashboard, describe the report you need in plain language and Canopy builds it - no query language, no waiting on another team. And because every part of the club runs on one platform, the AI works across all of your data, not one system at a time.
- Ask for a report in plain language - Canopy builds it
- Answers the questions your standard dashboards don't cover
- Works across every department, because the data is unified
- No query language, no analyst, no waiting on IT
- Real generative AI, not a static dashboard relabeled
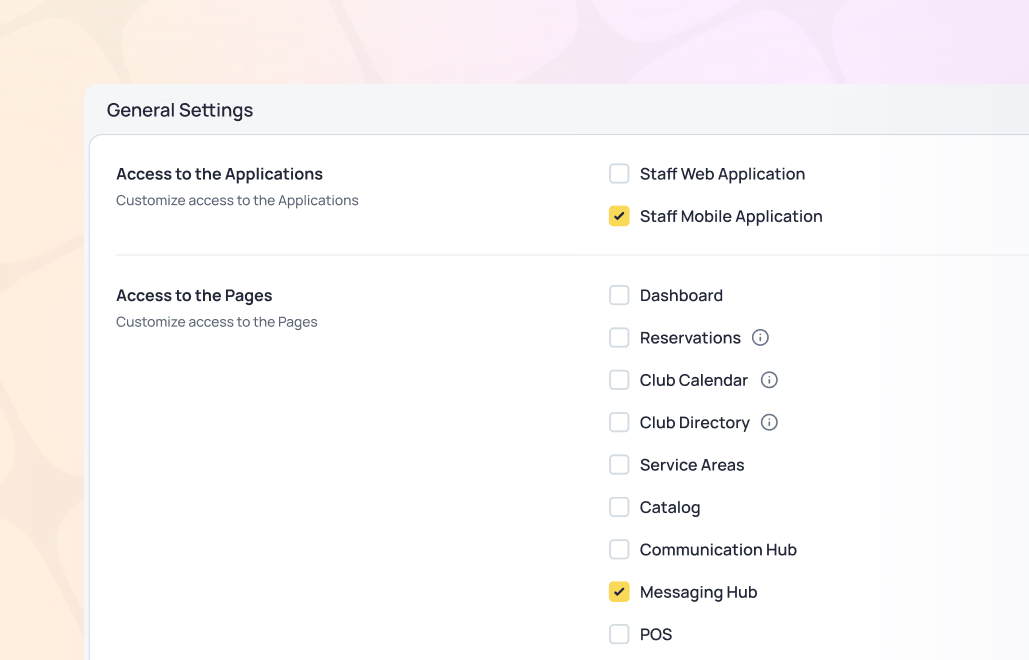
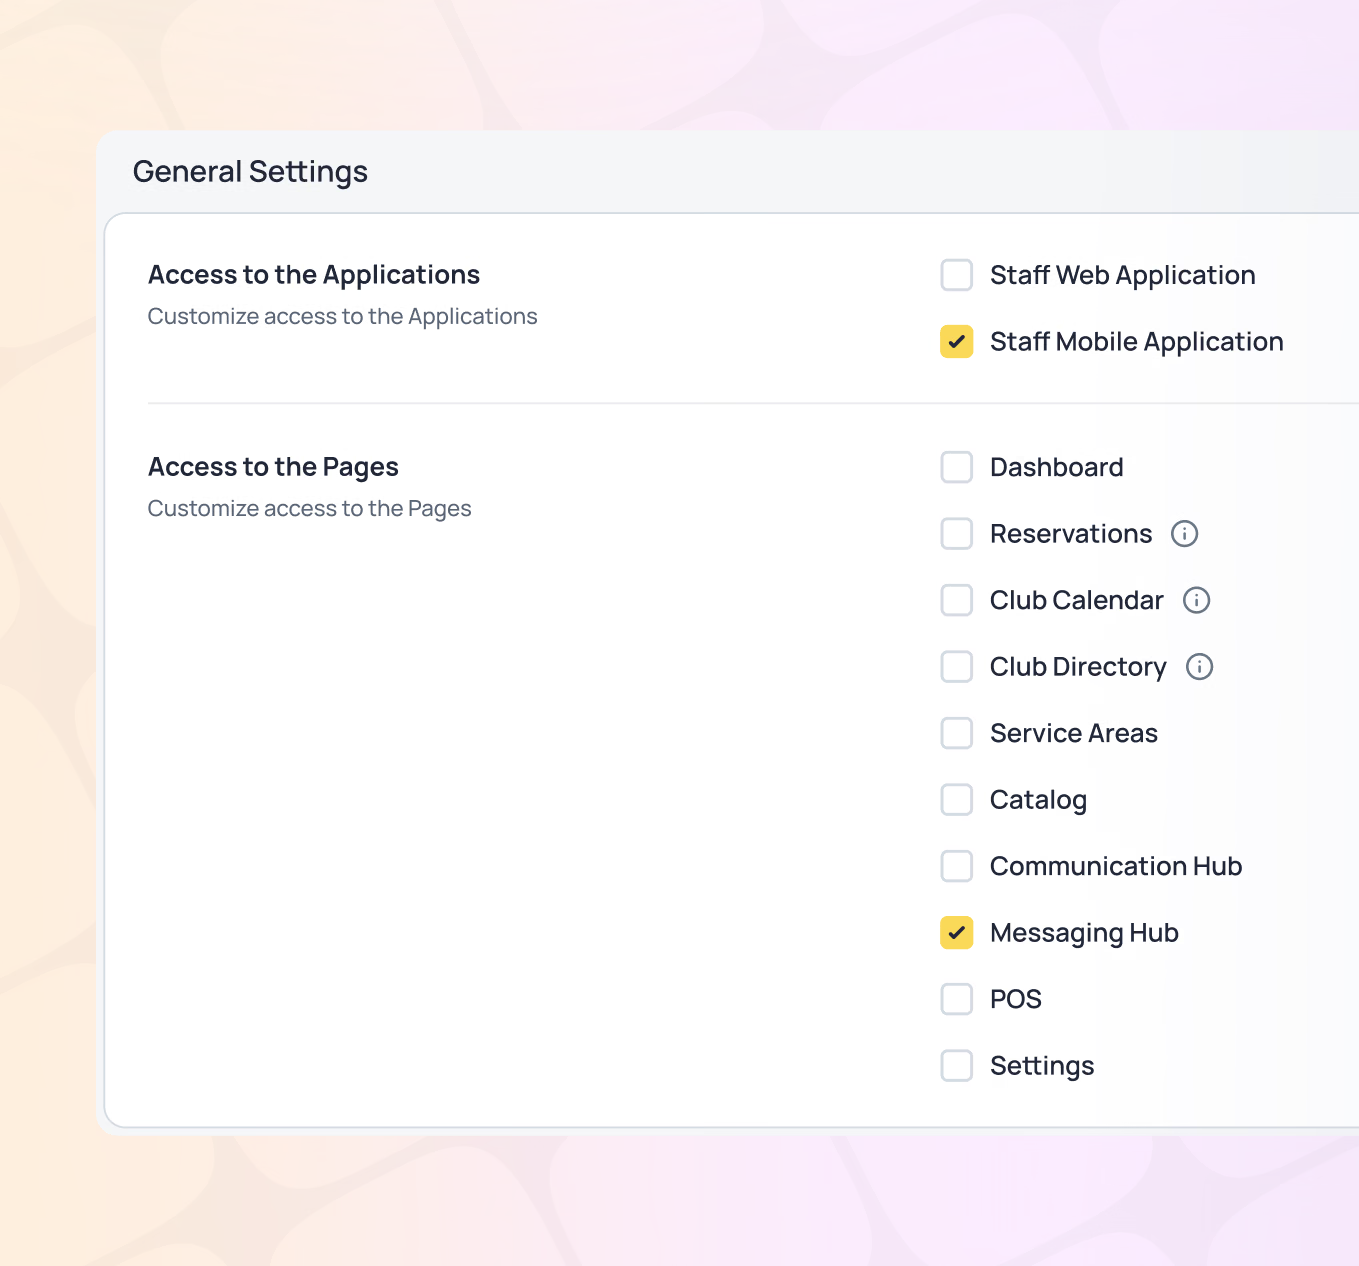
Data visibility is configured based on role - so every team member sees what they need and nothing they shouldn't. From GM-level visibility across the entire club to department-specific views for F&B, golf, or membership, access is controlled and purposeful. The right information reaches the right people, without requiring IT support to pull a report.
- Role-based data access controlled by permissions
- Department-specific views for F&B, golf, membership, and more
- GM and leadership access to club-wide performance data
- Staff-level access to relevant operational information
- Self-service reporting without IT involvement
How it works in the real world
Monday Morning Briefing
The GM arrives Monday morning and opens the dashboard. Weekend revenue across golf, dining, and events is visible at a glance - alongside who visited, member highlights from the weekend, open tasks, and upcoming events this week.
They click into F&B and see Saturday dinner ran at high capacity. They note it for the programming meeting. Two minutes in, the weekend is understood and the week ahead is framed - without sending a single email asking for a report.
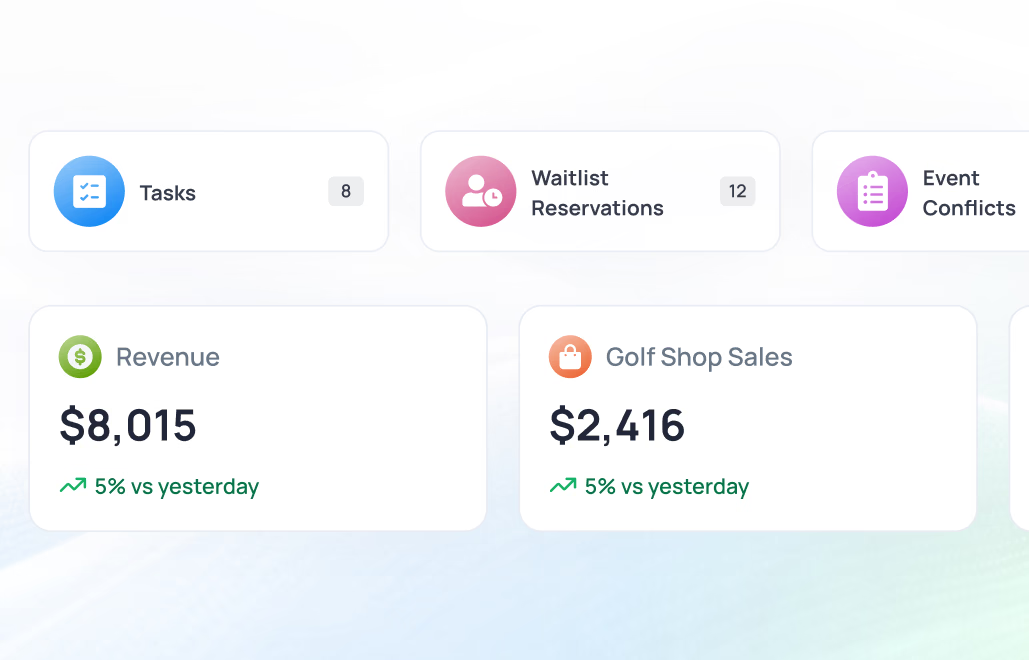
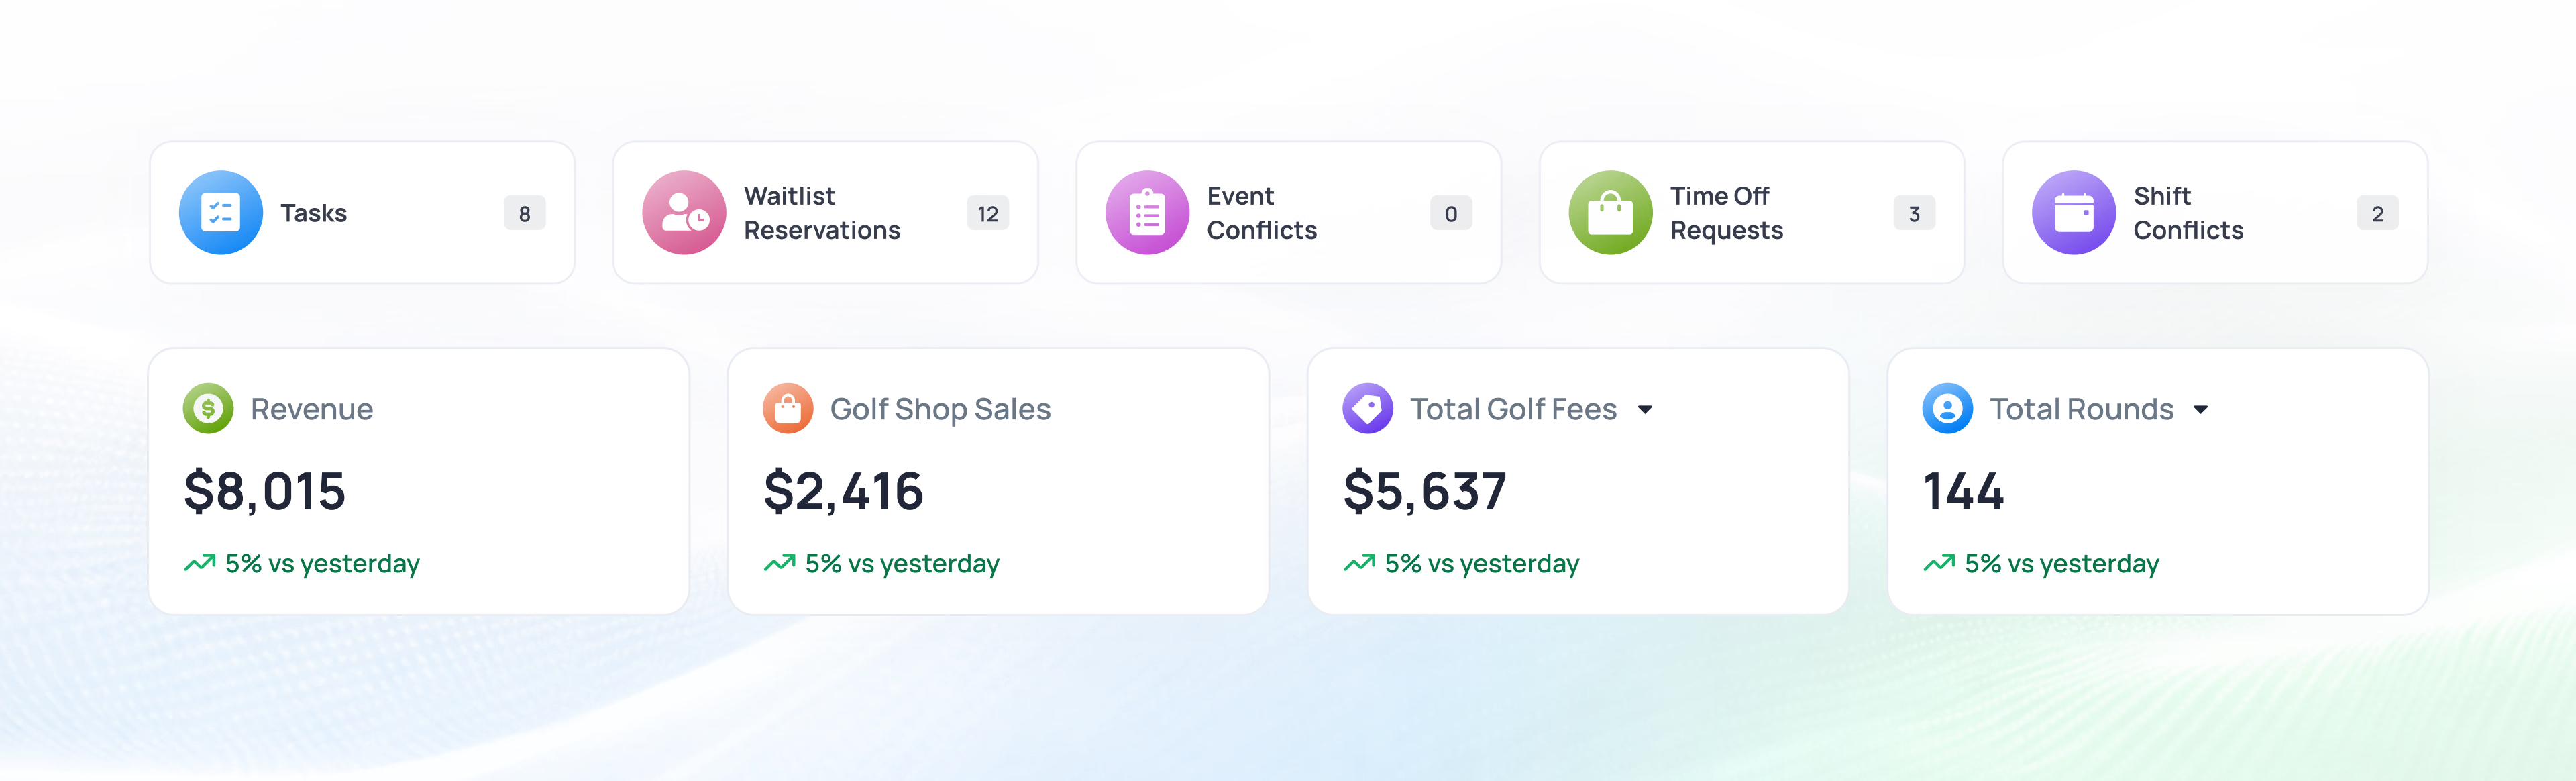
Result: A complete picture of the weekend - revenue, activity, member highlights, and open items - available before the first conversation of the day.
Membership Director's Monthly Review
The membership director opens their dashboard and reviews member activity for the month. They identify which membership types are most active by amenity and use the Communications module to send targeted event promotions to segments that haven't engaged recently.
They also note that a particular fitness program has strong participation and flag it for expansion. One view of the data, two actions taken - both aimed at increasing engagement and club revenue.
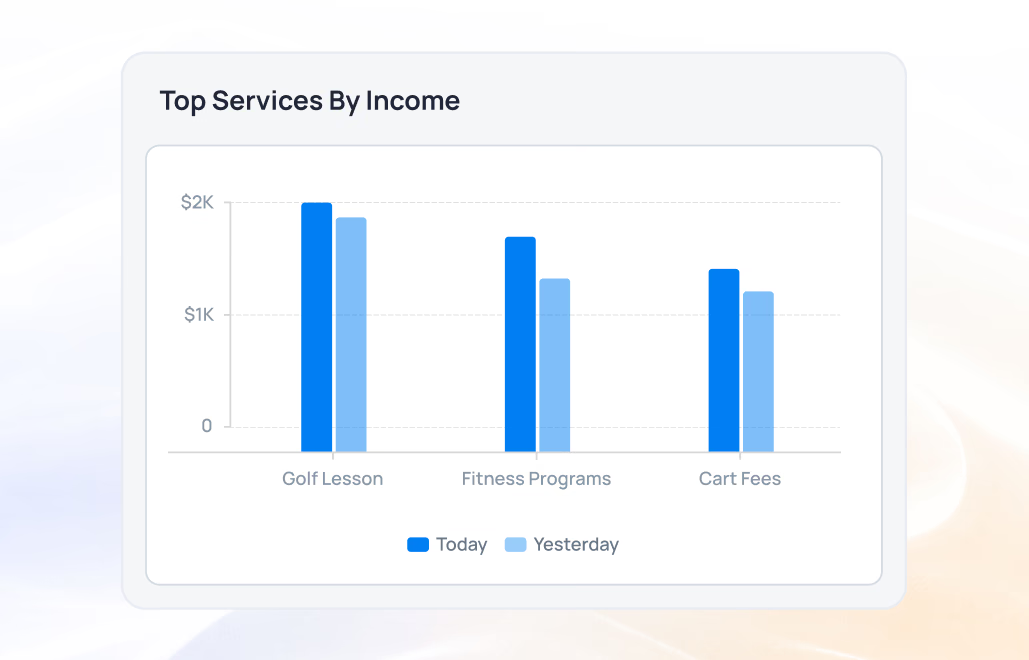
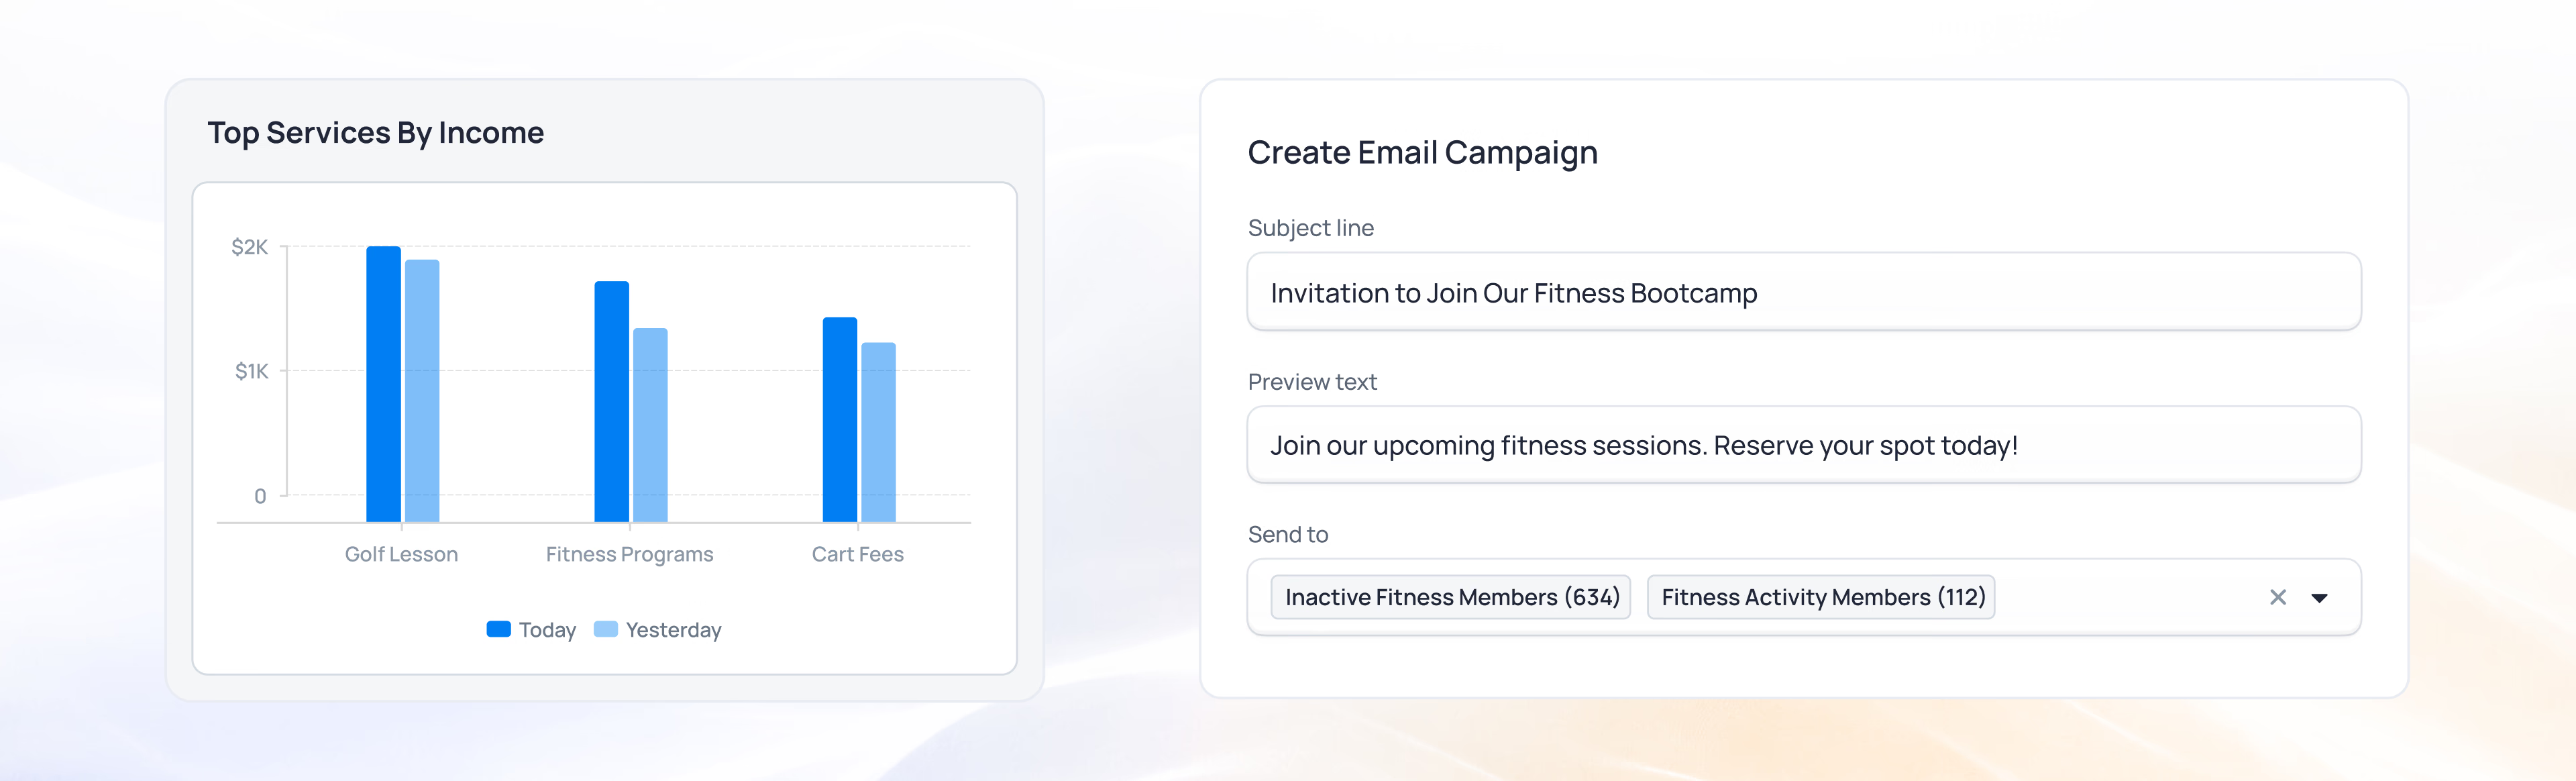
Result: One view of the data, two decisions - outreach sent, a program flagged to grow.
Value for everyone at your club
For General Managers
A complete view of club activity, member participation, and financial performance - with the member context to stay connected to the experience, not just the numbers. Balanced visibility across metrics and people keeps leadership informed and in tune.
Key Benefits: The whole club's numbers in one view, the member context behind them, decisions without a wait
For Department Heads
Track performance in your area - utilization, revenue, tasks, and team highlights - without waiting for IT to pull a report. Self-service access to the data that matters for your department, when you need it.
Key Benefits: Department-level visibility, self-service reporting, performance tracking
For Club Leadership & Board
Clear, current reporting without manual assembly: revenue, utilization, and membership trends in one picture, ready for the board conversation. The data to guide strategic decisions and demonstrate club health.
Key Benefits: A team that sees what's happening, usage and activity in plain view, decisions backed by real numbers
For Membership Directors
Understand how members and guests use the club - by membership type, by amenity, by activity - and use that insight to tailor outreach that brings more members in. A more active membership is a stronger membership.
Key Benefits: See how members use the club, tailor outreach to match, grow participation
See how your entire club stays in sync
From leadership insights to staff execution - everything connected.

Intelligence powered by your entire platform
Real-time intelligence aggregates data from every capability
From data to decision
1
Data Captured
Every transaction, reservation, event registration, and member interaction is recorded in real time across the platform. No manual data entry. No end-of-day uploads.
2
Insights Surfaced
Dashboards update automatically. Role-based views surface relevant information for each user. Highlights and alerts surface on the dashboard so nothing important is missed.

3
Action Taken
GM sees an opportunity in dining utilization and adjusts programming. Membership director identifies an underserved segment and runs a targeted campaign. Department head reviews task backlog and reassigns. Insight becomes action, directly from the dashboard.
Everything your club needs to turn data into action
From real-time capture to insights and decisions - all connected.

Real-time dashboards vs. scattered reports
Legacy Approach
Reports assembled manually from multiple systems. Data that's always a day or a week behind. Staff who need information have to ask for it or wait for month-end summaries. GMs who know what the club did financially but have limited visibility into member activity or participation. Decisions made with incomplete information.

Canopy Approach
One unified platform means one unified data set. Dashboards that update in real time. Role-based access means every team member has the view relevant to their work. Member activity, financial performance, operational highlights, and participation data all available without a request, a report, or a wait.
The Difference: When the platform is unified, the data is too - one picture the whole team can act on, every day.

See Real-Time Intelligence in action
Request a demo to see Real-Time Intelligence in action - from GM dashboards and utilization analytics to member activity highlights and department-level reporting. We'll show you how a unified platform makes complete visibility the default, not the exception.